You’ve got the CRM, now how do you make sense of the data?
Navigating CRM reports and dashboards can feel overwhelming, but understanding the data is vital to getting the most out of your CRM system. This article covers why CRM reports and dashboards matter, must-have CRM reports, common pitfalls and more.
💡 Book a free CRM strategy consultation
Why CRM Reports and Dashboards Matter
In today’s competitive landscape, decisions driven by gut instinct or outdated spreadsheets simply don’t cut it. CRM reports and dashboards play a pivotal role in helping sales, marketing, and customer service teams make smarter, faster, and more aligned decisions. They turn raw data into clear, actionable insights.
The Role of Data in Decision-Making
For sales teams, data reveals what’s working in the pipeline, which deals need attention, and how individual reps are performing against their targets. For marketing, it’s about understanding lead quality, campaign effectiveness, and conversion rates. And in customer service, reporting helps uncover response times, ticket volumes, and satisfaction trends—critical to improving the customer experience.
When teams have access to clean, centralized, and visual data, they’re empowered to make decisions that are not just reactive but strategic.
Common Problems Without Proper Reporting
Without effective CRM reporting:
- Lack of visibility becomes a major issue. Leaders can’t see where deals are getting stuck, which campaigns are underperforming, or how customer issues are being handled.
- Missed opportunities go unnoticed. Potential upsells, churn signals, or engagement gaps are buried in data silos.
- Teams become unproductive, wasting time pulling together manual reports or chasing information rather than acting on it.
This lack of clarity leads to inconsistent performance and fragmented customer experiences. These issues grow more costly as your business scales.
The Benefits of CRM Reports and Dashboards
Investing in strong CRM reporting pays off by delivering:
- Real-time insights: Whether you're tracking a deal's progression or a spike in support tickets, dashboards keep you in the loop as things happen, not days later.
- Goal tracking: Dashboards can visualize KPIs like quota attainment, marketing ROI, or service-level agreements, keeping everyone aligned and accountable.
- Proactive adjustments: With trends and anomalies surfaced quickly, teams can pivot strategies, reallocate resources, or course-correct before small issues snowball.
Ultimately, CRM reports and dashboards aren’t just tools, they’re your command center for driving consistent, data-backed success across every customer-facing function.
Understanding CRM Reports vs. Dashboards
While often used interchangeably, CRM reports and dashboards serve different but complementary purposes. Knowing when to use each, and how to combine them, can make your CRM insights more powerful and your decisions more precise.
Definitions
- Reports are in-depth, detailed views of your CRM data. They often focus on historical performance, trends, or granular breakdowns. Reports can be filtered, scheduled, and exported for meetings, audits, or deeper analysis.
- Dashboards are real-time, visual summaries of key metrics. Think of them as your quick-glance command center, pulling in live data through charts, graphs, and gauges to show you what’s happening right now.
When to Use CRM Reports and Dashboards and How They Complement Each Other
Use reports when you need:
- Deep dives into historical performance
- Comparative analysis across time, teams, or campaigns
- Scheduled exports for leadership or compliance
- To spot long-term trends and root causes
Use dashboards when you want:
- Real-time visibility into KPIs
- At-a-glance updates during daily standups or check-ins
- To monitor progress toward goals
- A customizable view of what matters most to you or your team
Together, they provide a full picture: dashboards highlight what’s happening, and reports explain why.
Quick Example: Pipeline Health vs. Sales Dashboard
- A Pipeline Health Report might show a detailed breakdown of every open deal by stage, owner, expected close date, and value. This is useful for end-of-week reviews or forecasting.
- A Sales Dashboard, on the other hand, might show real-time metrics like total pipeline value, top-performing reps, and how close the team is to hitting quota. This is perfect for daily sales huddles or executive overviews.
In short, reports are for digging deep, while dashboards are for staying sharp and responsive. Use both together to drive consistent, data-informed momentum.

Must-Have CRM Reports (Based on Role)
To make the most of your CRM, it’s essential to tailor reports to the specific needs of your team. Whether you’re leading sales, running marketing campaigns, or managing customer support, having the right reports ensures everyone stays aligned, accountable, and proactive.
For Sales Leaders
- Sales Pipeline / Funnel Reports
These reports visualize the health of your pipeline. They show deal volume at each stage, drop-off points, and where reps may need support. They help you forecast revenue, identify bottlenecks, and ensure a balanced flow of opportunities. - Deal Velocity and Win/Loss Analysis
Understand how quickly deals move through the pipeline and where they stall. Win/loss reports also reveal why deals are being won, or lost, so you can refine your sales approach, coaching, or qualification criteria.
For Marketing Teams
- Campaign Performance Reports
Measure how each campaign performs in terms of leads generated, engagement levels, and downstream revenue impact. This helps justify marketing spend and optimize future campaigns. - Lead Source and Conversion Rate Tracking
Track which channels (e.g., organic, paid, events, referrals) are driving the most qualified leads, and how well those leads convert into opportunities or customers. This ensures you’re investing in the right acquisition strategies.
For Customer Support Teams
- Ticket Volume and Resolution Time
Monitor the number of tickets created over time, average resolution time, and backlog size. These reports highlight workload trends, team performance, and potential service bottlenecks. - Customer Satisfaction Trends
Use post-interaction survey data (like CSAT or NPS) to spot satisfaction trends by product, issue type, or agent. This helps improve the customer experience and reduce churn risk.
Having the right reports aligned to each role turns CRM data into strategic insight. It empowers every team to focus on what matters most. Whether it’s closing deals, driving demand, or keeping customers happy.
Key Metrics to Track (Bottom and Middle Funnel)
Once leads are in your pipeline, the focus shifts to conversion, velocity, and retention. Tracking the right CRM metrics at the middle and bottom of the funnel helps you spot bottlenecks, measure performance, and make data-backed decisions to drive revenue growth.
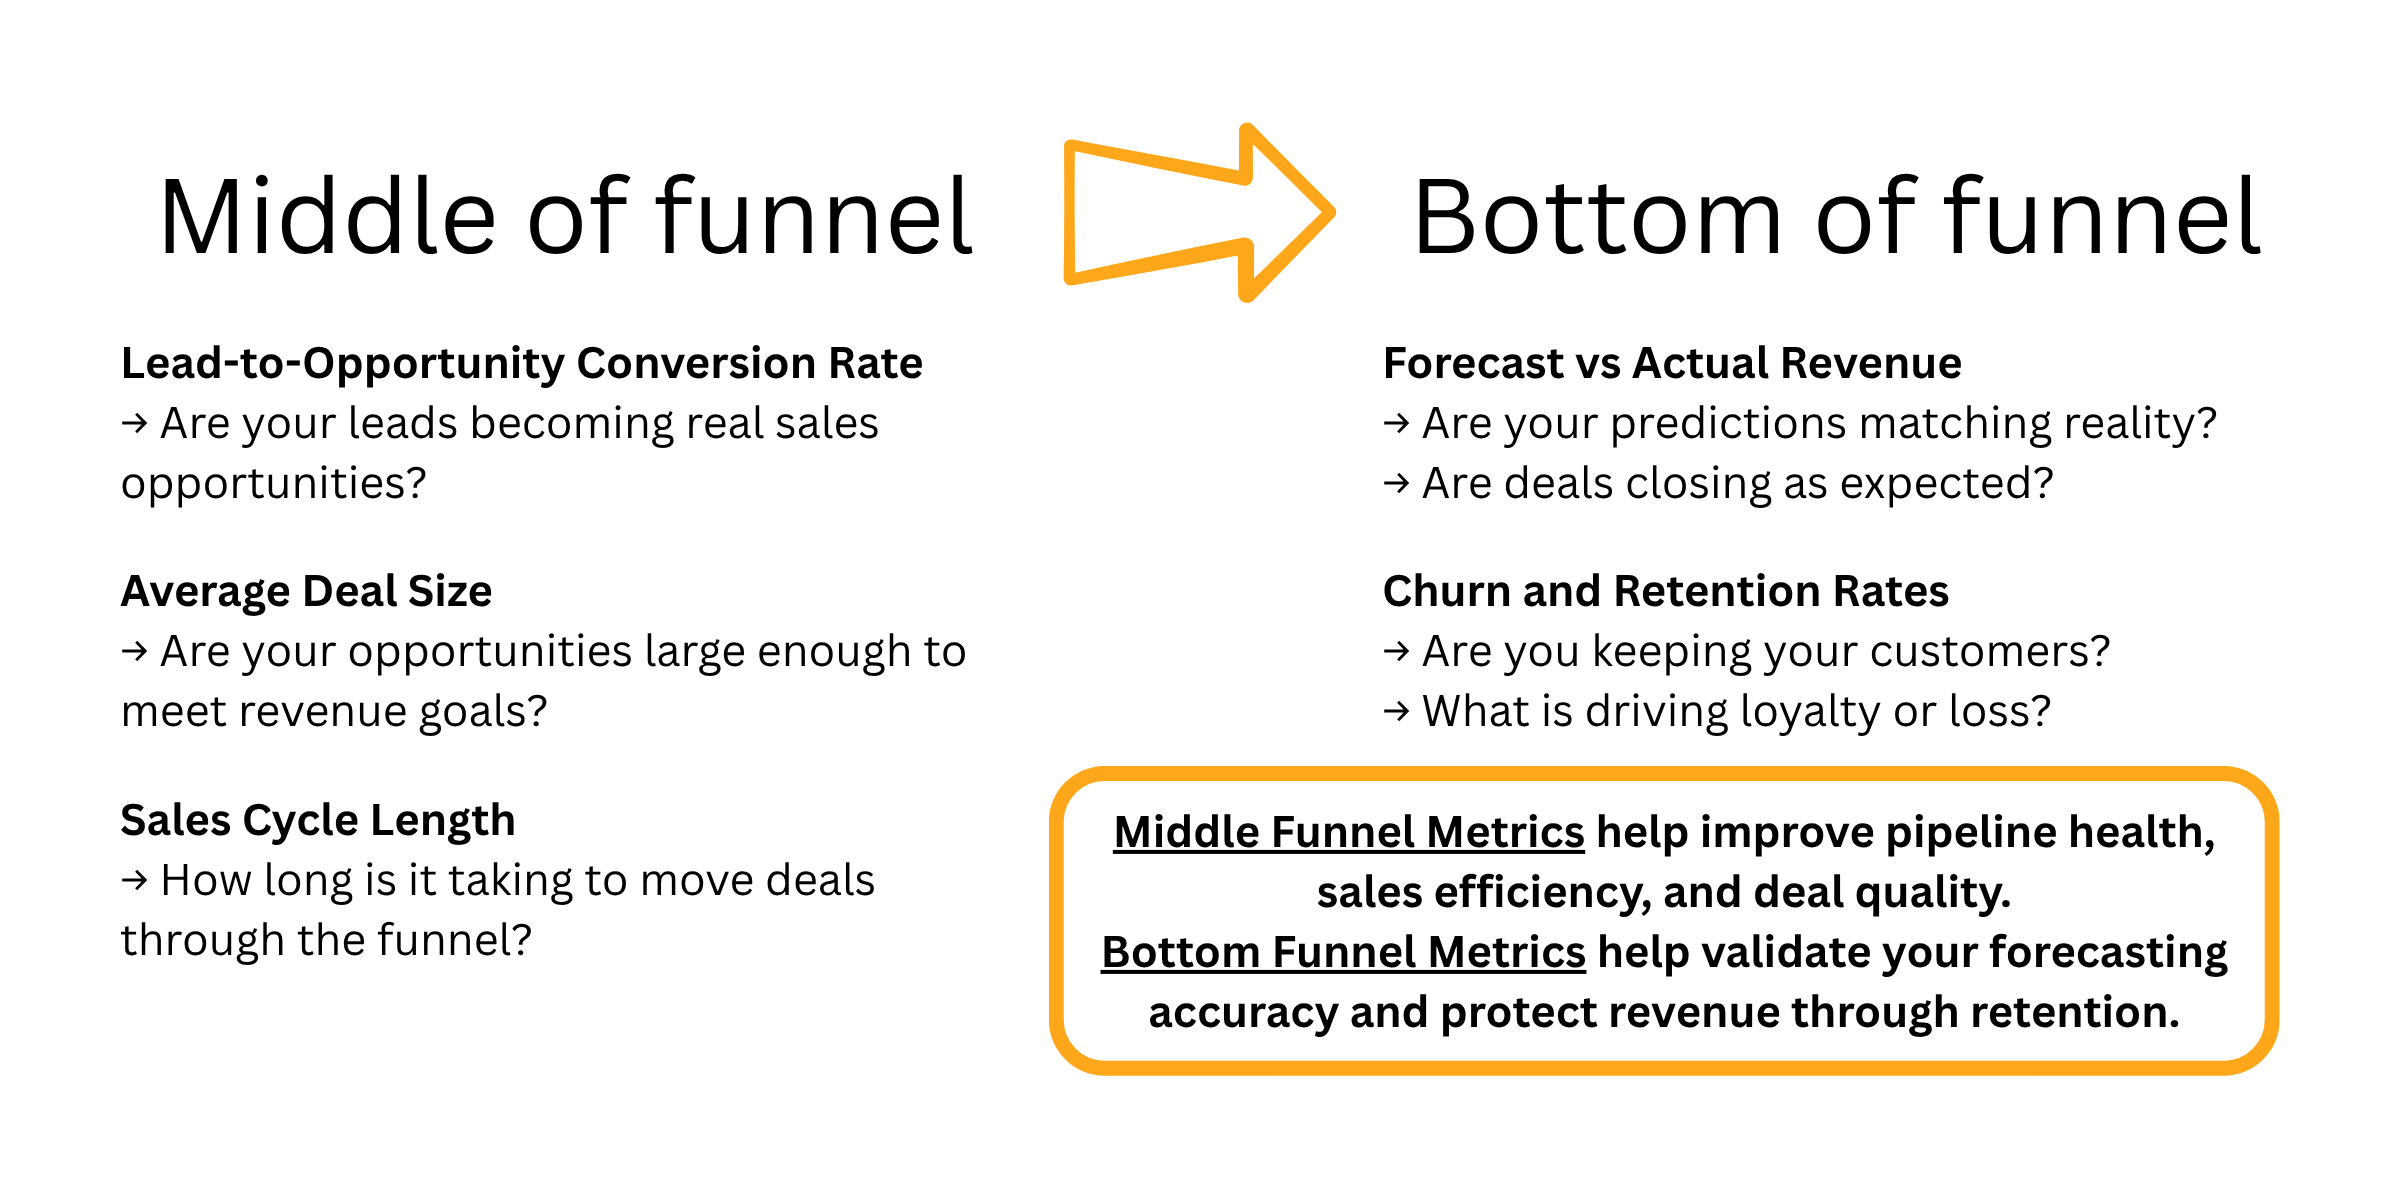
Here are the key metrics you should be monitoring consistently:
1. Lead-to-Opportunity Conversion Rate
This metric tells you how effectively your team is qualifying and nurturing leads into real opportunities.
Why it matters: A low rate may indicate poor lead quality, misaligned messaging, or gaps in your qualification process.
2. Average Deal Size
The average revenue generated per closed deal.
Why it matters: Tracking changes in deal size helps you evaluate pricing strategies, customer segments, and sales effectiveness. A rising deal size often signals improved targeting or stronger value positioning.
3. Sales Cycle Length
The average time it takes for a deal to move from initial contact to closed-won.
Why it matters: A longer sales cycle can point to friction in the buyer journey. By shortening this timeline, you improve forecasting accuracy and free up your sales team to close more deals faster.
4. Forecast vs. Actual Revenue
This compares your projected revenue against what your team actually closes.
Why it matters: Accurate forecasting reflects a strong handle on pipeline health and deal predictability. Gaps between forecast and actual often reveal overconfidence in late-stage deals or missed risks.
5. Churn and Retention Rates
Churn measures how many customers you lose over time, while retention tracks how many you keep.
Why it matters: These are critical for recurring revenue businesses. High churn often signals poor onboarding, weak support, or product misalignment, while strong retention is a sign of customer satisfaction and long-term growth potential.
Tracking these metrics not only sharpens your team’s performance, but also helps you anticipate challenges and refine your strategy at every funnel stage. When monitored regularly through CRM dashboards and reports, they become powerful levers for predictable, scalable success.
💡 Book a free CRM strategy consultation
Customizing Dashboards for Actionable Insights
A one-size-fits-all dashboard rarely works in practice. To unlock the full value of your CRM, dashboards must be customized by role, showing only the most relevant and actionable data for the person using them. This reduces noise, improves focus, and helps each user make faster, better-informed decisions.
Why Tailored Dashboards Matter
Different roles require different views. A frontline sales rep doesn’t need the same dashboard as a VP of Sales, just as a CMO and a marketing specialist have very different priorities. Role-based dashboards ensure that each team member gets insights aligned with their goals, responsibilities, and KPIs.
Real-World Examples
- Sales Rep vs. Sales Manager Views
- Sales Rep Dashboard: Focused on individual pipeline, open tasks, daily activity metrics, and deal stage progress. Helps reps prioritize their day and stay on track to quota.
- Sales Manager Dashboard: Higher-level view of team performance, deal velocity, win/loss trends, and forecast accuracy. Used to coach reps and optimize the pipeline.
- Sales Rep Dashboard: Focused on individual pipeline, open tasks, daily activity metrics, and deal stage progress. Helps reps prioritize their day and stay on track to quota.
- CMO vs. Marketing Specialist Dashboard
- Marketing Specialist Dashboard: Tracks campaign-level performance, email open rates, click-throughs, and lead engagement. Helps refine tactics and optimize in real time.
- CMO Dashboard: Looks at high-level KPIs like pipeline contribution, ROI by channel, customer acquisition cost (CAC), and marketing-sourced revenue. Used for strategic planning and executive reporting.
- Marketing Specialist Dashboard: Tracks campaign-level performance, email open rates, click-throughs, and lead engagement. Helps refine tactics and optimize in real time.
Tips for Usability and Impact
To make dashboards not just informative but actionable, keep these best practices in mind:
- Color Coding
Use red/yellow/green or similar schemes to highlight status at a glance (e.g., behind goal, on track, exceeding). This makes it easier to spot issues without reading every number. - Real-Time Alerts
Set up automated alerts for key thresholds (e.g., pipeline dip, high churn risk, SLA breaches). These prompt timely intervention instead of relying on manual checks. - Drill-Down Capabilities
Enable users to click into charts or metrics to see underlying data. This gives context—whether it's viewing the deals behind a forecast dip or the leads from a specific campaign.
By customizing dashboards to the unique needs of each role, and designing them for clarity and action, you turn your CRM from a data warehouse into a decision engine. The right dashboard doesn't just inform; it drives momentum.
Common Pitfalls and How to Avoid Them
Even with the best CRM tools in place, it's easy to fall into reporting and dashboard traps that limit effectiveness and overwhelm users. Below are the most common pitfalls, along with practical tips to avoid them.
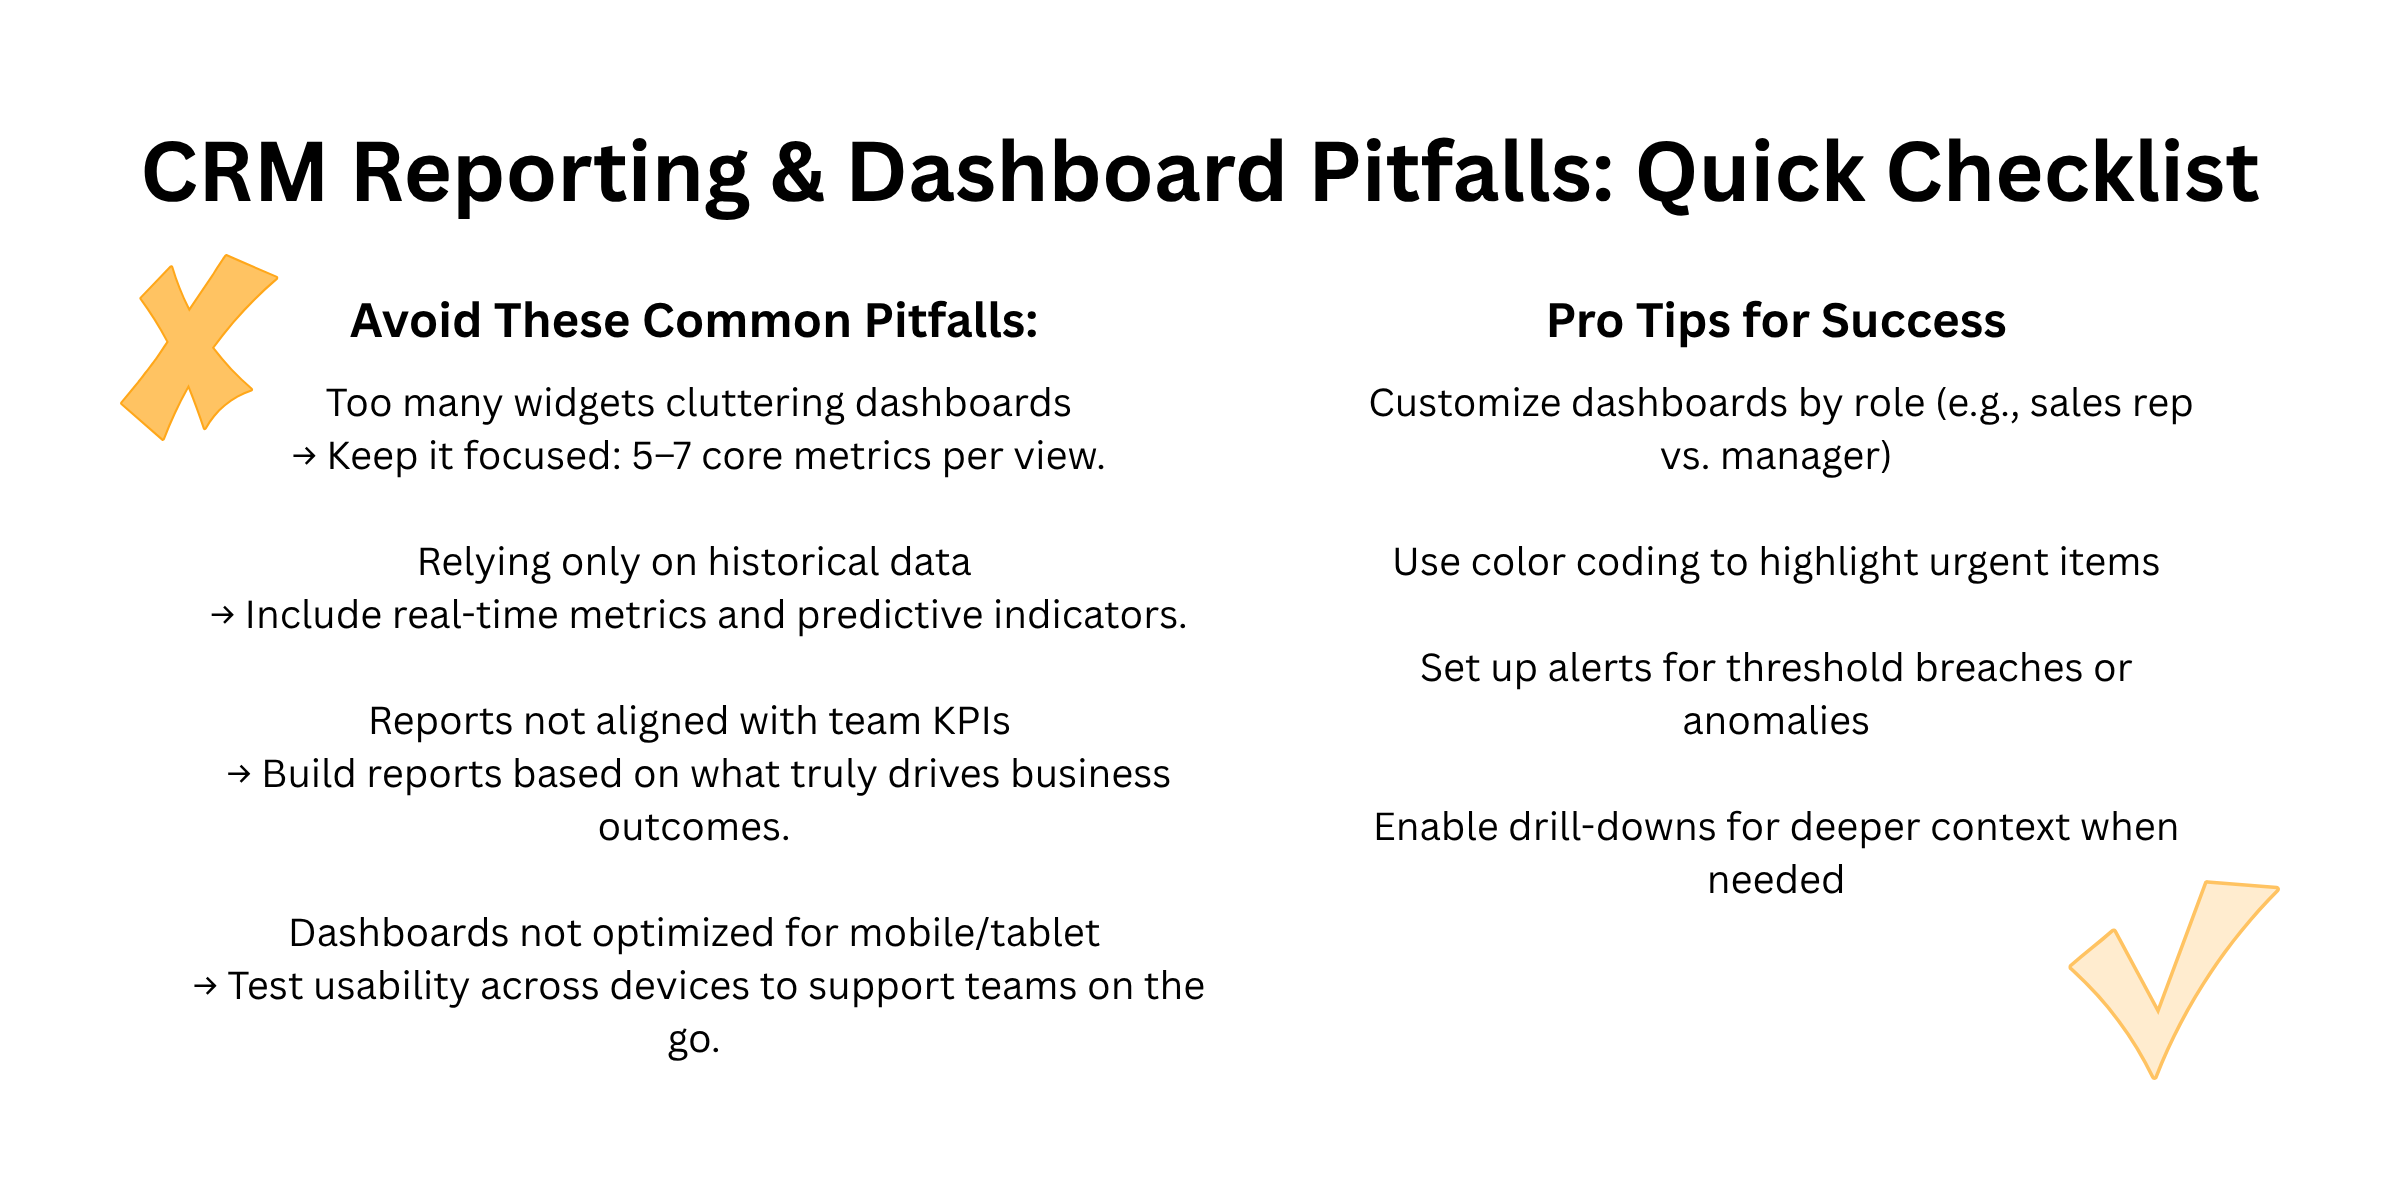
1. Overloading Dashboards with Too Many Widgets
The Pitfall:
Trying to show everything at once results in cluttered dashboards that confuse more than clarify. Users get overwhelmed, and important metrics get buried.
How to Avoid It:
Keep dashboards focused. Limit each dashboard to 5–7 key metrics that directly support the user’s goals. Use separate views for different themes (e.g., daily sales performance vs. quarterly trends).
2. Relying Only on Historical Data
The Pitfall:
While past performance is valuable, relying solely on historical data means you’re always looking in the rearview mirror and missing real-time opportunities or risks.
How to Avoid It:
Balance historical reports with real-time dashboards and predictive insights. Include leading indicators like deal activity, open tickets, or campaign engagement to spot trends early.
3. Not Aligning Reports with KPIs
The Pitfall:
If your reports aren’t tied to your team’s actual goals, they become noise. Tracking vanity metrics (like raw page views or call volume) without context can mislead decision-making.
How to Avoid It:
Start with your KPIs, then build your reports around them. Ask: Does this data help us measure progress toward our goals? If not, it doesn’t belong.
4. Ignoring Mobile/Tablet Responsiveness
The Pitfall:
Leaders and field teams often check dashboards on the go. A dashboard that only works well on a desktop can become useless when viewed on a phone or tablet.
How to Avoid It:
Test dashboards across devices. Use responsive layouts, simplified charts, and mobile-friendly filters so critical insights are accessible wherever your team works
By avoiding these pitfalls, you ensure your CRM reporting ecosystem stays lean, relevant, and usable. This supports fast decisions and real-time action across your organization.
💡 Book a free CRM strategy consultation
Tools and Integrations to Enhance Reporting
While most CRMs come with built-in reporting features, the real power comes from extending and integrating your tools to create deeper, more customized insights. Choosing the right tech stack can turn your CRM from a data tracker into a strategic decision-making engine.
Popular CRMs with Built-In Reporting
Here are some widely used CRMs that offer native dashboards and reporting tools:
- Salesforce
Highly customizable with advanced reporting features. Salesforce's built-in analytics are strong, especially when paired with Salesforce Einstein for AI-driven insights. - HubSpot
Offers user-friendly dashboards and customizable reports for sales, marketing, and service teams. This can be a great option for SMBs and mid-market businesses. - Zoho CRM
Affordable with robust reporting tools, especially when integrated with Zoho Analytics for deeper analysis. - Pipedrive, Microsoft Dynamics 365, Freshsales
Each has native reporting that supports sales pipeline tracking, activity metrics, and forecasting.
These platforms provide a solid foundation, but for more advanced visualization or cross-platform analysis, integrations are key.
Add-Ons & Integrations for Advanced Visualization
To go beyond what your CRM’s native tools offer, consider using add-ons and BI (business intelligence) platforms to enhance your reporting:
- Power BI (Microsoft)
Ideal for organizations already using Microsoft tools. Power BI lets you combine CRM data with other business systems and build dynamic, interactive dashboards. - Tableau (Salesforce-owned)
Powerful and flexible. Great for complex data sets, executive dashboards, and visual storytelling. Especially effective when paired with Salesforce. - Looker (Google Cloud)
Known for its deep analytical capabilities and semantic modeling. Ideal for businesses looking to unify multiple data sources into one view. - Google Data Studio
A free tool for creating custom dashboards and reports, particularly useful for marketing and web analytics when combined with CRM data. - Zoho Analytics
Pairs seamlessly with Zoho CRM but also integrates with other platforms. Offers AI-powered insights and pre-built templates.
Why Integrate?
- Richer Insights: Combine CRM data with marketing, finance, or product data for a holistic view.
- Custom Visuals: Use branded, role-specific visuals that go beyond native CRM charts.
- Cross-Department Alignment: Unified dashboards help sales, marketing, and service teams stay on the same page.
Tip: Before integrating, clarify what your team needs most—speed, customization, or scalability—and choose tools that fit those priorities without adding unnecessary complexity.
Final Takeaways and Next Steps
CRM reporting isn’t just about collecting data, it’s about turning that data into action. The right reports and dashboards help you move faster, make smarter decisions, and stay aligned across teams. Whether you're optimizing a sales pipeline, refining your marketing strategy, or improving customer experience, data-driven insights are the foundation of scalable success.
Recap: What Makes Reporting Work
- Tailored dashboards drive clarity for every role, from reps to executives.
- Actionable metrics like conversion rates, deal velocity, and churn help you diagnose and improve performance.
- Tools and integrations like Power BI, Tableau, and Looker can elevate your reporting beyond the basics.
Your Next Steps
- Audit Your Current Setup
Ask yourself: Are your dashboards focused, role-specific, and aligned with your KPIs? If not, it’s time for a refresh. - Identify Gaps and Prioritize Fixes
Look for cluttered dashboards, missing mobile responsiveness, or outdated metrics. These can lead to poor decisions or missed opportunities. - Collaborate Across Teams
Bring sales, marketing, and service leaders together to define what “success” looks like, and how to measure it. - Invest in Tools That Scale
As your business grows, so should your reporting capabilities. Choose tools and integrations that can grow with you.
💡 Book a free CRM strategy consultation
With a focused strategy and the right setup, your CRM can become more than just a system of record, it can become your competitive edge.
Are you ready to transform your CRM dashboards? Start with a simple audit and build from there. Small changes can lead to big impact.